M is for M-dwarf Models

When Prof. Brian Chaboyer visited from Dartmouth College, we heard all about theoretical models of M dwarfs – the smallest objects that are massive enough to properly be considered stars. Especially, he addressed the issue that for stars of about a half the mass of the Sun, current models predict main sequence stars that are either too luminous or too red by comparison to observations of stars in globular clusters. He explained that observational errors are down to about one percent, but that differences in theories vary by about four percent, and so the choice of model effects the interpretation of the observations. Whereas stellar atmospheric models can be verified by looking at the spectra of stars (Titanium Oxide is typically used to identify M-Dwarfs),  models of stellar interiors must map onto the bulk properties of the star such as radius, mass, age and rotation. To measure some of these bulk properties for comparison with his and other models, Prof. Brian Chaboyer studied transiting binary stars and compared his results to computational stellar structure models.

from http://www.sketchplease.com/index.php?s=matryoshka

Frenzied globs of gas though they may be, the interiors of stars can be dealt with by taking them to be spheres, composed of many concentric shells,  reminiscent of a Matryoshka doll.  One wants to know how four particular properties vary from the innermost shell to the outermost, such as pressure, mass, luminosity and temperature gradients. We expect these properties to be interdependent, and they are, which is reflected in four coupled differential equations of stellar structure. Using these equations is akin to asking the following questions:


Question: What change in pressure at each shell would be required to support a star against its own gravity?

Answer:

The Pressure is balanced by the force of gravity, defined in terms of the mass of each shell and the density.


Quenstion: How does the amount of mass differ between each shell?

Answer:

The total mass of the star can be arrived at by summing the mass density at every spherical shell.


Question: How much energy is passing through the surface of each shell at any given time?

Answer:

Luminosity is related to radius, density, and the rate of energy production by nuclear fusion or by changes in gravitational potential energy.


What is the temperature change at each layer?

…. This answer depends on whether energy transport occurs by radiation or convection.

For radiative heat transfer:

Derived by equating expressions for radiation pressure, the change in temperature relates to the opacity at a given shell, the energy flowing through it, and the temperature of the shell. By inspection, we can see that a high opacity and high luminosity give a steep temperature gradient, which is an impetus for convection. The opacities of small, cool stars are challenging because they are cool enough to contain molecules. There is another temperature gradient equation for convective transfer which comes from the first law of thermodynamics, and depends on which equation of state the gas can be considered to have. M-dwarfs are relatively compact stars where effects like degeneracy pressure play a role in the equation of state of the interior. (So said Prof. Pierre Demarque, Prof. Charboyer’s thesis advisor, who was in attendance at this colloquium.)

You can observe for yourself how some of the above properties change for stars of different mass using this applet made available by Dr. Brian Martin of King’s college.

Having a theoretical description of the bulk properties of the stars, Prof. Charboyer used a method employing binary star transits to find their radii. The basic idea was not unlike the now-familiar transit planet-finding method, in that measurements are taken during dips in the light curve when one of the orbiting bodies eclipses the other.
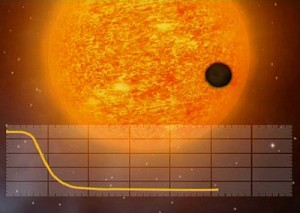
Image from ESA

The transit planet-finding method gives the radius of a transiting companion relative to that of its companion. By contrast, Prof. Charboyer used the orbital velocity of the stars and the duration of the eclipse to establish the absolute radius of the objects. Taking the stars to be tidally locked – meaning that their rotational periods are given by their orbital periods – gives a rotation-radius relation that can then be used to fit to models. Prof. Charboyer reasoned that faster rotators would be stronger magnetic dynamos, causing them to have inflated radii, explaining the increased luminosity in observations. He didn’t consider such effects as differential rotation of the stars, but maybe we’ll hear more about that in relation to the Kepler mission targets if we receive a visit from Lucianne Walkowicz later this semester.

M-dwarfs themselves have come to be promising places to find habitable planets, precisely because the ratio of star to planet brightness is lower than for more massive stars. Thanks to the lower temperatures of M-dwarfs, habitable planets could exist close in to the star, their short periods making the chance of catching a transiting Earth-like planet pretty good.


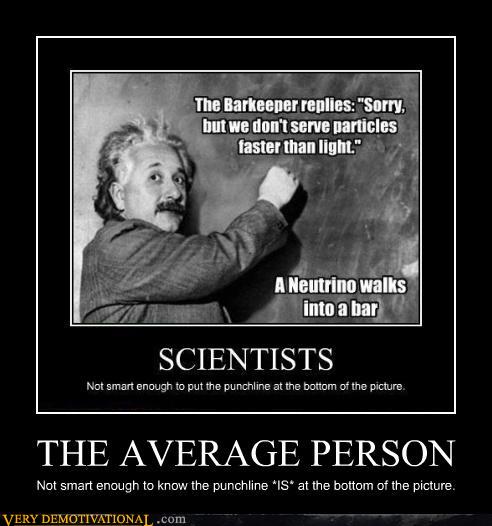
Superluminosity: A Conversation in the Wake of Reported Faster-than-light Neutrinos.

A pair production between: Holly Capelo and Guy Geyer.


Holly: This fall was an exciting time to be studying special relativity, given that one of the most noteworthy recent science-news headlines was the possible violation of the universal speed limit, c, by superluminal neutrinos. Most of the press coverage on the OPERA report of a neutrino beam traveling through the Earth at a speed greater than light in a vacuum, was some variant on: “Einstein wrong, scientists baffled.” The attitude amongst most scientists I know was more like, “Let’s check the results, what a curiosity!” I myself wondered why Lorentz and Poincare’ weren’t given equal credit for the theory of special relativity.

As the process of investigating the results proceeds, we report on the most convincing evidence that there was no superluminal phenomenon detected, but first discuss what specifically was wrong with a paper that briefly offered the promise to explain the results using special relativity. Relativity can be counter-intuitive at times, so as a sanity check and to enrich the discussion, I have asked a fellow student, Guy Geyer to add his opinion on the same letter (which, according to Denis Overbye’s reporting, has been revised and is now under peer review, following the admission by the author of some of his early mistakes). Guy and I were asked to do a similar exercise at the culmination of a quarter-long course in Relativity taught by Prof. Fred Ellis this fall.

Since the Opera experiment released its results in September it has already received over 140 (and counting) citations from theories trying to justify the findings. Dr. van Elburg of the Department of Artificial Intelligence at the University of Groningen offered up a simple explanation for the recently-observed apparent superluminal motion of neutrinos passing through the Earth between an origin at Gran Sasso Italy to CERN Switzerland. He suggests that the measurement of the time of flight of the neutrino was actually measured from the frame of the GPS satellite, where length contraction would reduce the distance traveled according to the GPS clock, therefore shortening the time of required to cover the distance.
His paper was heavily reported upon, probably because it seems to be a simple solution that invokes special relativity and exactly reproduces the discrepancy in timing reported in the OPERA publication. This is attractive in some respects; after all, it is often a simple oversight that can disrupt a complicated process. Although, the solution may be a little too simple, since in order for special relativity to offer a sufficient explanation, one needs to establish that the Earth and satellite frames are inertial within the accuracy of the experiment – otherwise General Relativity must be invoked. As for the exact value of 64 nanoseconds, the striking similarity to the reported discrepancy may be accidental since the calculations made in the paper are done to very low-order precision.

Here are the elements of the experimental setup to consider:
The general procedure of measuring the neutrino flight time consist of a few procedural steps: 1. Determine the distance of the neutrino flight path baseline using a satellite – referred to as geodesy; 2. Bounce a radio signal originating from CERN off of a satellite towards the Gran Sasso location for the purpose of synchronizing cesium atomic clocks on either end (fiber optic cables running through the Earth were used to very verify the synchronization of the clocks and agreed to within 2 nanoseconds); 3. Having synchronized clocks at the neutrino production and detection sites, measure the distributions of departure and arrival times of the neutrinos in the Earth frame. The steps were carried out roughly in this order, although the geodesic measurements are on-going, as small shifts in the Earth’s crust need to be accounted for.

Guy: Regarding #2, This is the part of the experiment that I thought was most unclear… It isn’t really explained that well how exactly the OPERA clocks were synced. If they accounted for spec. and gen. relativity correctly to sync their clocks to earth frame time, then there shouldn’t be a problem. However, it’s still not clear to me that this is what is happening in their experiment.

Holly: You’re right, the original paper gives a schematic of these elements, but it isn’t entirely clear which calculations were made or how interdependent each of these aspects of the setup really are. Assuming that they are fairly independent, it seems to me that once the clocks are synchronized and the distance determined, then the satellite frame of reference becomes irrelevant to the measurement. Van Elburg defines a “foton” as a particle traveling at light speed, which could refer to either a radio photon used to synchronize clocks or to the neutrino beam itself. In failing to distinguish between these separate sets of events and paths in spacetime, he does not establish the need to consider the GPS frame when making the time measurement of the neutrino’s flight.
Van Elburg maintains that he is not concerned about a mistake in the time synchronization, but that the experiment could have been setup in the GPS clock frame.

Guy: I didn’t take away this impression – maybe there is something that I missed, but I thought he was saying that the mistake CERN made was that they didn’t properly account for how they were synchronizing the clocks.

Holly: Yes, I think that his argument boils down to a problem with the synchronization between clocks, but I ‘m not convinced that HE realizes that. I mean that Van Elburg claimed that the experiment was set up in the satellite frame and then proceeded to make some length contraction calculations of the baseline, but he doesn’t address any of the accompanying problems that come from trying to take coordinated time measurements between stationary and moving clocks. In particular, path- and velocity-dependent time dilation effects and a lack of synchronization with the Earth clocks would ensue.
I think the bottom line is that, although the details of the synchronization were not very explicit, Van Elburg’s premise that the experimenters forgot to change reference frames is easily refuted by looking to the original OPERA paper. The authors of the OPERA paper were conscious of having transformed back to the Earth Frame after measuring the baseline:

“The other fundamental ingredient for the neutrino velocity measurement is the knowledge of the distance between the point where the proton time-structure is measured at CERN and the origin of the underground OPERA detector reference frame at LNGS. The relative positions of the elements of the CNGS beam line are known with millimetre accuracy. When these coordinates are transformed into the global geodesy reference frame by relating them to external GPS benchmarks, they are known within 2 cm accuracy.”

So that would put the experiment back – at rest – on Earth once the baseline has been determined.

Guy and I weren’t the only ones to point out some ambiguities in the van Elburg paper which may have stemmed from the non-explicit nature of the OPERA paper itself. Such missing details make it difficult for outsiders (such as van Elburg or ourselves) to speculate about the experimental setup and any issues it may have had. Experimentally reproducing the results and proving the existence of physically related phenomena are likely to be more definitive tests of the claimed results.

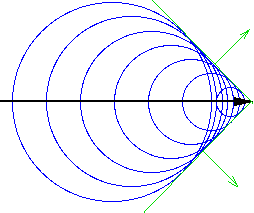
More recently and perhaps more authoritatively, some relative insiders, involved with the sister project to the OPERA group known as ICARUS, have now produced a manuscript to be published in the Physical Review Letters verifying that none of the expected byproducts of superluminal motion were detected. Apart from the specific timing measurements, they considered by analogy one example where particles are known to travel faster than light speed in a given material**, which creates Cherenkov radiation. They argue that since neutrinos decay into additional particles as they lose energy, this energy loss both caps the maximum velocity of the particles and leads to the expectation that the decay products should have been detected. Using the same neutrino beam as the OPERA group, they found no such evidence for the expected decay behavior.

**Note that although the comparison to Cerenkov radiation is by analogy (the neutrino beam was claimed to have traveled faster than the vacuum speed of light) the fact that the particle beam did travel through a medium was lost on some people, leading to an embarrassing gaffe by the Italian Ministry of education, congratulating themselves for contributing to the construction of a “tunnel” between the two detector points (separated by over 500 KM, the longest tunnel in the world is about 20% this distance!) This statement received some cool response here. However, this is not the only tunnel that has been conjured in response to the findings, as dozens of theories evoking quantum behavior have arisen as well.

APOW: Library at night

A note: Just as the plans of mice are wont to do, so too have my own to post an astronomy picture every week gone awry. I therefore am changing this to Astronomy Pictures of Whenever, allowing more freedom in when they can be posted as well as retaining the fetching acronym APOW.

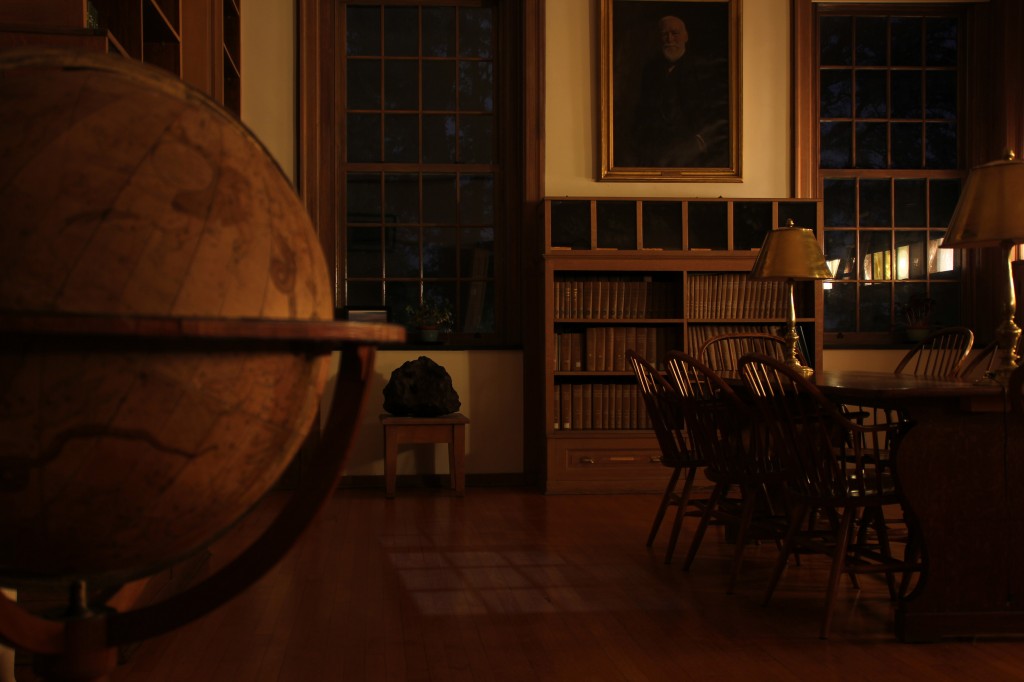
We have here a view of the Van Vleck Observatory library at night. Taken around the end of August 2011 there are many things astronomical to see. How many can you find?

Starting on the left we can see a celestial globe displaying the positions of stars and constellations for the year 1800. You can get a better feel for what this is showing by imagining that the Earth is inside the center of this globe and you are looking outward at these constellations. You can see in the upper right portion the constellation Boötes, the herdsman (by his right arm is the label for this celestial globe: “Cary’s New and Improved Celestial Globe”). To his right is Serpens Caput, the head of the snake with which Ophiuchus (unseen) wrestles. In the bottom portion can be seen the tail of Hydra, the sea serpent which Hercules was tasked to kill.

In the distance just to the right of the celestial globe can be seen part of a 150ft wide, 60-million pound meteor which slammed into Earth approximately 50,000 years ago forming the 1-mile wide Barringer “Meteor” Crater in Arizona . This roughly one cubic-foot, nickel-iron meteorite chunk weighs an impressive 370lbs!

Splayed on the floor in front of the meteorite we have moonlight streaming in through the window. Hearkening back to the previous APOW (‘Star trails’), if you were to watch this moonlight for even a few minutes you would notice its movement across the floor caused by Earth’s gentle rotation.

Reflected in the far right window can be seen 20th century photographic plates of celestial objects taken at various different observatories, including our own. In the window pane furthest to the right can be seen an image of the Andromeda galaxy (née ‘Andromeda Nebula’). The light we see from the Andromeda galaxy left around the time when primitive humans were first fashioning stone tools and our current species was no where close to existing. Over the intervening few (~2) million years our current species evolved, we domesticated plants and animals, invented writing and spread across most of the world. During all this time the light from Andromeda was still hurtling towards us through space. The Ancient Egyptians, Greeks and Romans came and went; the Pyramids, Parthenon and Colosseum were built. The light was still chugging along. Bill Shakespeare wrote sonnets and some plays; Galileo pointed a telescope at the night sky, then got in trouble; Newton took a sick day and invented calculus, discovered fundamental laws of motion. The light, still cruising along at 67 million mph, was now within the bounds of our Galaxy. The United States was founded, split and reformed. The light, well outside our solar system, was still further than even the nearest stars. Then one clear night, likely in the second half of the 20th century, an observer at the Yerkes Observatory in Wisconsin decided to turn their 24-inch reflecting telescope (the same size and model as our very own) towards the Andromeda galaxy for 4.5 hours. The light (photons), after their many millions of light-years journey from Andromeda, ended by being absorbed in the atoms and molecules of a curious astronomer’s photographic plate. The light having traveled so long that a species was able to evolve, invent tools, and create a state decidedly the shape of Wisconsin, such that an observer could ‘trap’ these photons on a plate of chemicals at the end of a tube of mirrors, instead of having their journey be all for naught by bouncing off the observatory’s roof.

To the left of the reflected photos we see the portrait of our observatory’s namesake: John Monroe Van Vleck, head of Wesleyan’s Department of Mathematics and Astronomy in the mid-1800s. Underneath him are photographic plates (unlit) showing the bountiful starfields visible in our own Milky Way Galaxy, you’ll have to come see them for yourself; below the plates are more than 50 years worth of astronomical research journals.

So with that, and under the watchful gaze of J.M. Van Vleck, we end our astronomical tour of this delightful little library. Adieu.